July was the busiest month for non-British nationals arriving at the UK border in 2025, with 9.9% of the year's arrivals, and February the quietest, with 6.3%. July and August together accounted for 19.6%. This is a border count of every non-British arrival, not a count of visitors.
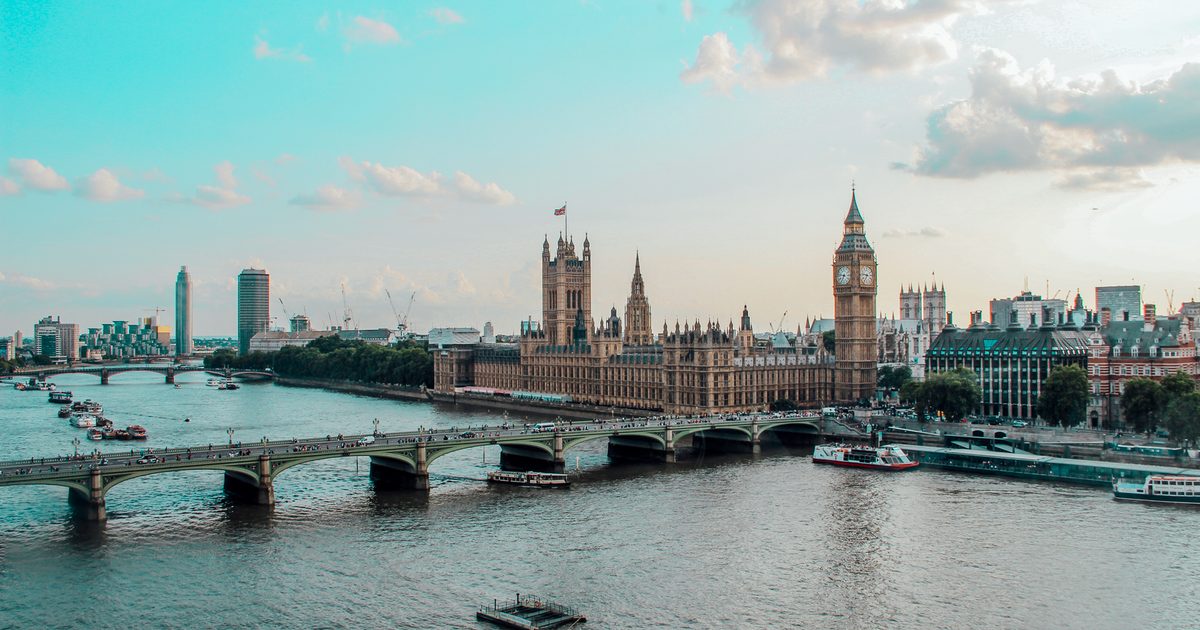
A border count, not a visitor count. Anyone who is not British and comes through UK border control is counted, whatever the reason for the trip. The Home Office says most will be short-term arrivals such as visitors, “with smaller numbers arriving for other reasons (such as work, study, family and humanitarian reasons)”.2 It does not say how many of each.
The UK, month by month
- Two busiest months
- Other months
When do the most non-British nationals arrive in the UK, and when the fewest?
July had the most non-British arrivals at the UK border in 2025, with 9.9% of the year's total. February had the fewest, with 6.3%. That makes July 1.6 times as busy as February.1
Five months each had less than an average month's share of 8.3%: January, February, March, November and December.
Where do these arrivals come from?
The Home Office table splits arrivals only by “nationality group (British, all other)”, so it cannot show which countries these arrivals come from, and we do not show a breakdown.3
What exactly is counted?
The Home Office counts passenger arrivals from Border Force records. In its words, the data “counts Border Force interactions at the UK border” for all modes of transport. It splits arrivals by nationality group, British and all other, and we use the all other nationalities figure. It goes by nationality, not where people live, so British nationals who live abroad are not in it. Each figure is rounded to the nearest 1,000.1
Other countries count arrivals differently, which is why we do not rank the UK against the others on the overview page.
June or September? May or October?
June and September were almost identical, at 9.1% and 9.2%.
October was quieter than May, at 8.4% against 8.8%.
These compare months at similar distances from the middle of the year. They say nothing about weather, which we have not measured.
What these figures cannot tell you
Arrivals are not crowds. A month with many arrivals can still feel quiet if visitors stay briefly or spread out, and a national total cannot show how busy one city, park or beach is.
They say nothing about length of stay, weather or prices. This page has no weather or price data.
Arrivals from Ireland are missing. The count does not capture arrivals from the Common Travel Area: people entering the UK through it are not required to present their passport and are not included in the data.12
Some people are counted more than once. The Home Office says a passenger may be counted more than once where more than one interaction occurred, and that the figures are estimates. Its user guide adds that the system “was not designed for statistical purposes”, so the data should be treated as indicative.13
Rounded figures. The twelve months add to 59,049,000, while the Home Office's published total for 2025 is 59,048,000. The difference is rounding, which the Home Office notes.1
They are one year. These are 2025 figures, and patterns shift from year to year.
The full year
| Month | Share of year | Arrivals |
|---|---|---|
| January | 7.2% | 4,238,000 |
| February | 6.3% | 3,724,000 |
| March | 7.4% | 4,378,000 |
| April | 8.5% | 5,021,000 |
| May | 8.8% | 5,176,000 |
| June | 9.1% | 5,360,000 |
| July (one of the two busiest months) | 9.9% | 5,854,000 |
| August (one of the two busiest months) | 9.7% | 5,747,000 |
| September | 9.2% | 5,447,000 |
| October | 8.4% | 4,988,000 |
| November | 7.3% | 4,320,000 |
| December | 8.1% | 4,796,000 |
Total for 2025: 59,049,000 non-British arrivals at the UK border. The two busiest months are marked. The months add to 59,049,000; the published total is 59,048,000 because each figure is rounded separately.
Key takeaways
- February was the quietest month for non-British nationals arriving at the UK border in 2025, with 6.3% of the year's arrivals.
- July and August were the busiest, with 19.6% between them.
- June and September were almost identical, at 9.1% and 9.2%.
- What we would skip: comparing these percentages with another country's. Each country counts arrivals its own way.
Sources
Every figure on this page comes from the Home Office, a UK government department. We downloaded the monthly figures and calculated the shares and comparisons ourselves. See how we research.
- Source: Home Office, Immigration system statistics, year ending June 2026, Passenger arrivals summary tables (published 27 August 2026), table Arr_02 “Monthly passenger arrivals in the UK by nationality”, 2025 Total Other Nationality arrivals, January–December 2025, and the notes to the tables. Read it. Accessed 25 September 2026. Contains public sector information licensed under the Open Government Licence v3.0. This page is not endorsed by the Home Office.
- Home Office, How many people come to the UK each year? (year ending June 2026). Read it. Checked 25 September 2026.
- Home Office, User guide to Home Office immigration statistics, section 6, passenger arrivals. Read it. Checked 25 September 2026.
Changes we made. The monthly shares, rankings of months and comparisons are our own calculations from the published counts. Percentages are rounded to one decimal place, so they may not add exactly.